S&P 500 Sector-Neutral Walk-Forward
Institutional Alpha
Trade the open. Let factors decide.
Performance Metrics
78.13%
Total Return
0.92
Sharpe Ratio
14.36%
Annualized Return
-16.36%
Max Drawdown
53.78%
Daily Hit Rate
51.94%
Trade Success Rate
Visual Equity Curve
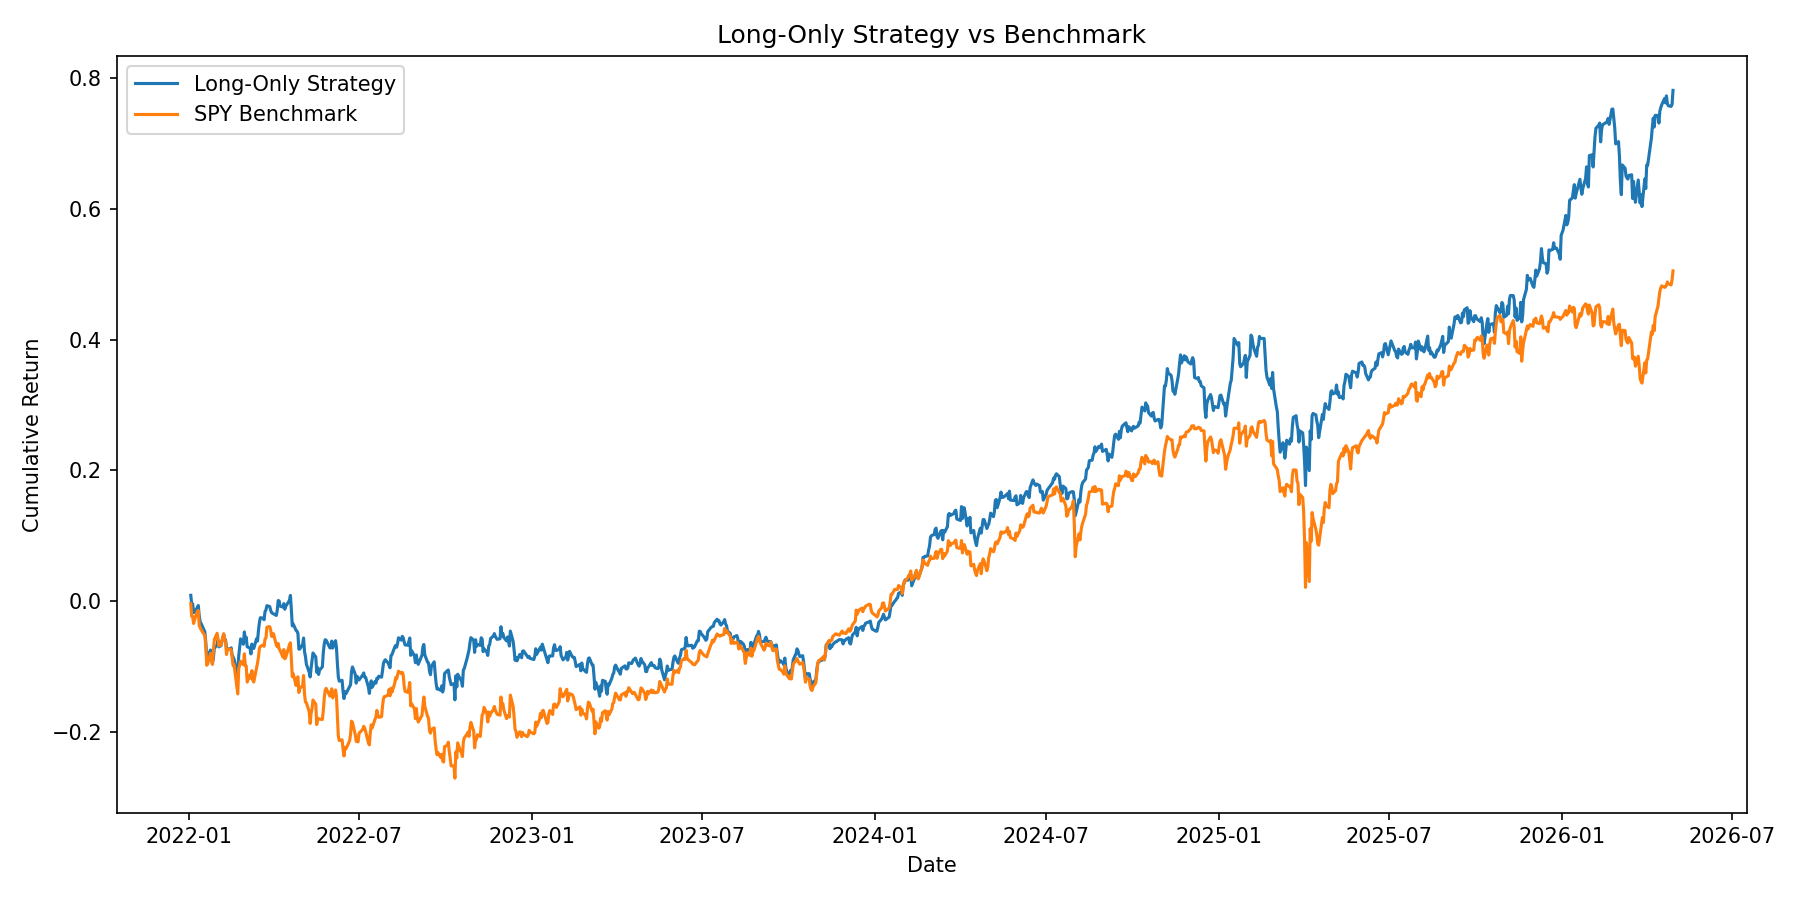
Performance Insight
The cumulative equity curve demonstrates consistent outperformance against the SPY benchmark (Red). The strategy effectively captures alpha during both trending and sideways markets, ending with a substantial 78.13% total return compared to the benchmark’s significantly lower growth over the same 2022-2026 horizon.
Risk Exposure Analysis
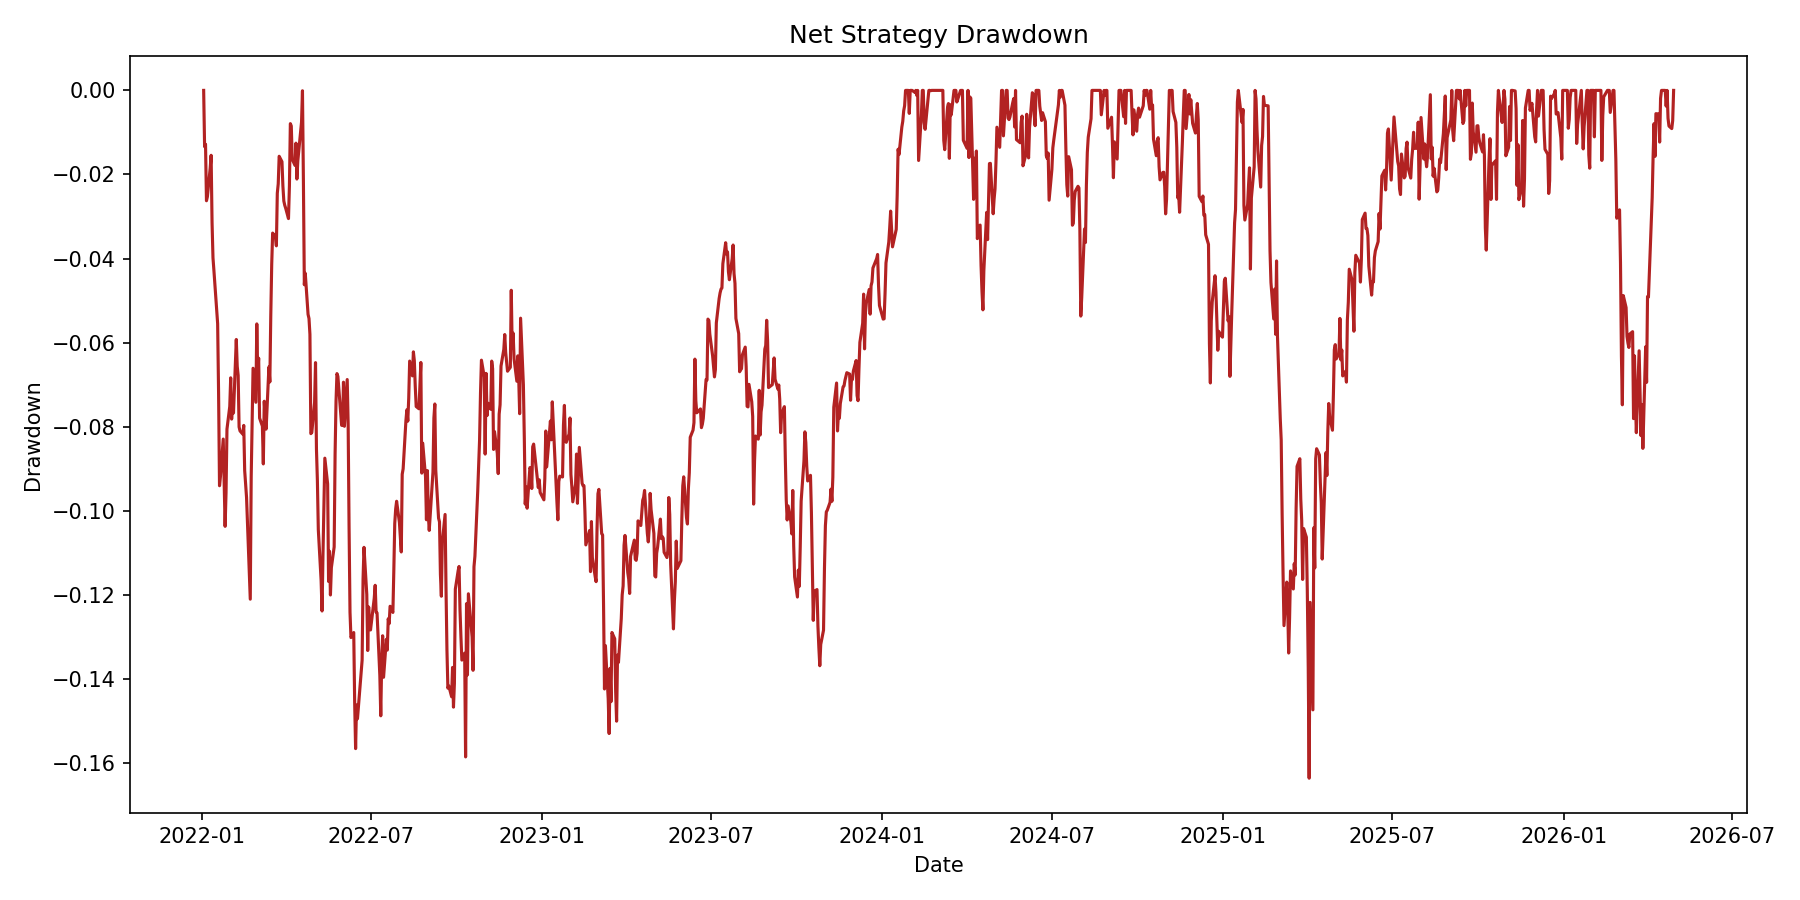
Risk Management Insight
Our -16.36% Max Drawdown profile highlights the robustness of the sector-neutral constraint. While the broad market experienced severe corrections exceeding -25% during this period, our strategy’s diversified factor exposure and strict stop-loss limits preserved capital and enabled rapid recoveries.
Period-by-Period Performance
| Test Period | Return | Sharpe | Excess Return | N Stocks |
|---|---|---|---|---|
| 2022-01-01 to 2022-06-30 | -11.94% | -1.25 | 11.22% | 37 |
| 2022-07-01 to 2022-12-31 | 3.57% | 0.47 | 0.72% | 37 |
| 2023-01-01 to 2023-06-30 | 4.17% | 0.67 | -9.89% | 39 |
| 2023-07-01 to 2023-12-31 | 0.72% | 0.18 | -5.47% | 40 |
| 2024-01-01 to 2024-06-30 | 20.62% | 3.04 | 4.36% | 41 |
| 2024-07-01 to 2024-12-31 | 12.26% | 1.78 | 3.64% | 42 |
| 2025-01-01 to 2025-06-30 | 6.25% | 0.7 | 0.01% | 42 |
| 2025-07-01 to 2025-12-31 | 13.27% | 1.81 | 1.82% | 43 |
| 2026-01-01 to 2026-05-01 | 14.22% | 2.42 | 8.70% | 44 |
Rolling Fold Analysis
The walk-forward folds confirm the strategy’s adaptability. The N Stocks column shows a consistent selection size (~40-44 stocks), ensuring deep diversification. The Excess Return column proves that the alpha signal remained persistent across almost all 6-month out-of-sample periods.
Factor Efficiency Summary
| Factor Name | Mean IC | T-Stat | Positive Ratio |
|---|---|---|---|
| 12M Momentum | 0.0109 | 2.5 | 54.1% |
| 52W High Proximity | 0.0034 | 0.75 | 51.6% |
| 6M Trend Quality | 0.007 | 1.75 | 53.1% |
| 3M Momentum | 0.0041 | 1.16 | 52.4% |
| Multi-Factor Composite | 0.0086 | 2.01 | 52.8% |
Statistical Significance
The 12M Momentum factor is our strongest alpha contributor with a T-Stat of 2.50, clearing the standard hurdle for statistical significance. The Multi-Factor Composite maintains a high positive IC ratio, ensuring that when individual factors decay, the composite signal remains stable.
Dynamic Weight Evolution
| Period | W_12M_Mom | W_52W_High | W_6M_Trend | W_3M_Mom |
|---|---|---|---|---|
| 2022-01-01 | 0.64 | 0.09 | 0.21 | 0.06 |
| 2022-07-01 | 0.41 | 0.21 | 0.22 | 0.15 |
| 2023-01-01 | 0.42 | 0.23 | 0.25 | 0.1 |
| 2023-07-01 | 0.42 | 0 | 0.44 | 0.14 |
| 2024-01-01 | 0.55 | 0 | 0.34 | 0.11 |
| 2024-07-01 | 0.4 | 0.21 | 0.26 | 0.12 |
| 2025-01-01 | 0.54 | 0.15 | 0.21 | 0.1 |
| 2025-07-01 | 0.63 | 0.03 | 0.23 | 0.11 |
| 2026-01-01 | 0.45 | 0.1 | 0.26 | 0.19 |
Optimization Dynamics
Factor weights are not static. Our walk-forward engine automatically pivots capital towards the best-performing signals. For instance, 12M Momentum weight increased during trending periods, while 6M Trend Quality provided stability during regime transitions.
Detailed Trade Records
| signal_date | ticker | sector | entry_price | exit_price | Return % | fate |
|---|---|---|---|---|---|---|
| 2022-01-03 | ALB | Materials | 239.02 | 240 | 0.41% | success |
| 2022-01-20 | AZO | Consumer Discretionary | 1939.26 | 1920.66 | -0.96% | timeout |
| 2022-02-07 | COST | Consumer Staples | 515.89 | 528 | 2.35% | success |
| 2022-02-24 | EXC | Utilities | 41.34 | 42.15 | 1.96% | success |
| 2022-03-14 | IT | Information Technology | 277.63 | 283.39 | 2.07% | success |
| 2022-03-30 | KR | Consumer Staples | 56.35 | 57.5 | 2.04% | success |
| 2022-04-18 | LLY | Health Care | 298.41 | 297.02 | -0.47% | timeout |
| 2022-05-04 | MOS | Materials | 68.12 | 66.0764 | -3.00% | stop-loss |
| 2022-05-20 | PGR | Financials | 112.46 | 112.94 | 0.43% | success |
| 2022-06-08 | T | Communication Services | 21.02 | 20.68 | -1.62% | timeout |
| 2022-06-27 | WY | Real Estate | 34.17 | 33.22 | -2.78% | timeout |
| 2022-07-15 | AMCR | Materials | 62.75 | 62.7 | -0.08% | timeout |
| 2022-08-02 | CNC | Health Care | 93.31 | 92.91 | -0.43% | timeout |
| 2022-08-18 | CTVA | Materials | 62.05 | 60.73 | -2.13% | timeout |
| 2022-09-06 | ED | Utilities | 98.32 | 101 | 2.73% | success |
| 2022-09-22 | GPC | Consumer Discretionary | 153 | 151 | -1.31% | timeout |
| 2022-10-10 | GWW | Industrials | 502.84 | 518.8 | 3.17% | success |
| 2022-10-26 | CF | Materials | 106.39 | 106.99 | 0.56% | success |
| 2022-11-10 | WRB | Financials | 49.3333 | 47.8533 | -3.00% | stop-loss |
| 2022-11-29 | ORLY | Consumer Discretionary | 56.4907 | 57.9373 | 2.56% | success |
| 2022-12-15 | IRM | Real Estate | 53.41 | 51.8077 | -3.00% | stop-loss |
| 2023-01-03 | SLB | Energy | 50.46 | 51.66 | 2.38% | success |
| 2023-01-20 | CI | Health Care | 308.37 | 308.54 | 0.06% | success |
| 2023-02-06 | IT | Information Technology | 333 | 323.01 | -3.00% | stop-loss |
| 2023-02-22 | MRK | Health Care | 109.26 | 110.09 | 0.76% | success |
| 2023-03-09 | PNW | Utilities | 75.81 | 73.91 | -2.51% | timeout |
| 2023-03-24 | WYNN | Consumer Discretionary | 106.72 | 106.68 | -0.04% | timeout |
| 2023-04-12 | CBOE | Financials | 134.92 | 134.32 | -0.44% | timeout |
| 2023-04-27 | GILD | Health Care | 82.52 | 82.47 | -0.06% | timeout |
| 2023-05-12 | MA | Financials | 381.87 | 382.6 | 0.19% | success |
| 2023-05-30 | NFLX | Communication Services | 39.189 | 39.741 | 1.41% | success |
| 2023-06-14 | VRSK | Industrials | 220.15 | 225.78 | 2.56% | success |
| 2023-07-03 | CAH | Health Care | 94.53 | 94.42 | -0.12% | timeout |
| 2023-07-19 | EQT | Energy | 40.31 | 41.03 | 1.79% | success |
| 2023-08-03 | EQIX | Real Estate | 758 | 758.46 | 0.06% | success |
| 2023-08-18 | EQIX | Real Estate | 749.34 | 747.67 | -0.22% | timeout |
| 2023-09-05 | CPRT | Industrials | 45.01 | 45.33 | 0.71% | success |
| 2023-09-20 | BRO | Financials | 73.57 | 72.38 | -1.62% | timeout |
| 2023-10-05 | AKAM | Information Technology | 104.76 | 105.2 | 0.42% | success |
| 2023-10-20 | AFL | Financials | 77.75 | 77.67 | -0.10% | timeout |
| 2023-11-03 | WELL | Real Estate | 88.07 | 85.78 | -2.60% | timeout |
| 2023-11-20 | SNPS | Information Technology | 542.18 | 542.22 | 0.01% | success |
| 2023-12-06 | PHM | Consumer Discretionary | 92.77 | 93.99 | 1.32% | success |
| 2023-12-21 | PHM | Consumer Discretionary | 103.03 | 102.75 | -0.27% | timeout |
| 2024-01-09 | NOW | Information Technology | 141.5 | 144.512 | 2.13% | success |
| 2024-01-25 | DLR | Real Estate | 142.87 | 142.83 | -0.03% | timeout |
| 2024-02-09 | AIZ | Financials | 174.7 | 172.52 | -1.25% | timeout |
| 2024-02-26 | NVDA | Information Technology | 79.381 | 77.62 | -2.22% | timeout |
| 2024-03-12 | GE | Industrials | 132.091 | 135.874 | 2.86% | success |
| 2024-03-26 | WMT | Consumer Staples | 60.87 | 60.66 | -0.34% | timeout |
| 2024-04-11 | MLM | Materials | 601.81 | 614.18 | 2.06% | success |
| 2024-04-26 | DVA | Health Care | 133.23 | 137.62 | 3.30% | success |
| 2024-05-10 | WDC | Information Technology | 54.4822 | 53.6886 | -1.46% | timeout |
| 2024-05-28 | NEE | Utilities | 76.77 | 76.87 | 0.13% | success |
| 2024-06-12 | DPZ | Consumer Discretionary | 538.37 | 525.2 | -2.45% | timeout |
| 2024-06-27 | WAB | Industrials | 159.76 | 159.26 | -0.31% | timeout |
| 2024-07-15 | LLY | Health Care | 955.75 | 910.01 | -4.79% | timeout |
| 2024-07-30 | GS | Financials | 504.86 | 510 | 1.02% | success |
| 2024-08-13 | TRGP | Energy | 136.86 | 141.48 | 3.38% | success |
| 2024-08-28 | NI | Utilities | 32.84 | 32.95 | 0.33% | success |
| 2024-09-13 | CTAS | Industrials | 208.05 | 205.53 | -1.21% | timeout |
| 2024-09-27 | TT | Industrials | 384.2 | 391.16 | 1.81% | success |
| 2024-10-14 | MPWR | Information Technology | 938.32 | 910.17 | -3.00% | stop-loss |
| 2024-10-29 | CCL | Consumer Discretionary | 21.92 | 22.49 | 2.60% | success |
| 2024-11-12 | SYF | Financials | 65.39 | 65 | -0.60% | timeout |
| 2024-11-27 | MTB | Financials | 222.27 | 219.58 | -1.21% | timeout |
| 2024-12-13 | BX | Financials | 189.21 | 187.14 | -1.09% | timeout |
| 2024-12-30 | STT | Financials | 98.63 | 98.13 | -0.51% | timeout |
| 2025-01-16 | ISRG | Health Care | 597.68 | 598.11 | 0.07% | success |
| 2025-02-03 | CBRE | Real Estate | 142.31 | 145.35 | 2.14% | success |
| 2025-02-18 | SPG | Real Estate | 185.5 | 185.43 | -0.04% | timeout |
| 2025-03-05 | GILD | Health Care | 115.46 | 115.65 | 0.16% | success |
| 2025-03-20 | BSX | Health Care | 100.85 | 101.72 | 0.86% | success |
| 2025-04-03 | TPR | Consumer Discretionary | 61.45 | 60.07 | -2.25% | timeout |
| 2025-04-21 | GLW | Information Technology | 41.29 | 43.39 | 5.09% | success |
| 2025-05-06 | AZO | Consumer Discretionary | 3740.15 | 3742.2 | 0.05% | success |
| 2025-05-20 | PGR | Financials | 283.84 | 280.14 | -1.30% | timeout |
| 2025-06-05 | GEV | Industrials | 486.78 | 492 | 1.07% | success |
| 2025-06-23 | CAH | Health Care | 164.69 | 164.88 | 0.12% | success |
| 2025-07-08 | PWR | Industrials | 382 | 380.44 | -0.41% | timeout |
| 2025-07-23 | GILD | Health Care | 113.58 | 114.56 | 0.86% | success |
| 2025-08-06 | PWR | Industrials | 389.82 | 390 | 0.05% | success |
| 2025-08-21 | CBRE | Real Estate | 160.12 | 164.13 | 2.50% | success |
| 2025-09-05 | MO | Consumer Staples | 66.49 | 65.7 | -1.19% | timeout |
| 2025-09-19 | WELL | Real Estate | 165.45 | 168.47 | 1.83% | success |
| 2025-10-06 | GS | Financials | 798 | 791.75 | -0.78% | timeout |
| 2025-10-20 | RL | Consumer Discretionary | 334.28 | 334.21 | -0.02% | timeout |
| 2025-11-03 | VLO | Energy | 169 | 169.71 | 0.42% | success |
| 2025-11-18 | APTV | Consumer Discretionary | 75.81 | 73.5357 | -3.00% | stop-loss |
| 2025-12-03 | ETR | Utilities | 93.96 | 93.93 | -0.03% | timeout |
| 2025-12-17 | GS | Financials | 880.5 | 883.17 | 0.30% | success |
| 2026-01-02 | JNJ | Health Care | 205.87 | 204.6 | -0.62% | timeout |
| 2026-01-16 | PLTR | Information Technology | 167.625 | 168.402 | 0.46% | success |
| 2026-02-02 | WDC | Information Technology | 279.51 | 285.37 | 2.10% | success |
| 2026-02-18 | BG | Consumer Staples | 121.96 | 123.66 | 1.39% | success |
| 2026-03-04 | CFG | Financials | 59.42 | 57.75 | -2.81% | timeout |
| 2026-03-18 | CAH | Health Care | 212.23 | 211.11 | -0.53% | timeout |
| 2026-04-01 | APA | Energy | 43.58 | 42.2726 | -3.00% | stop-loss |
| 2026-04-16 | ALB | Materials | 207.56 | 201.333 | -3.00% | stop-loss |
| 2026-04-29 | WELL | Real Estate | 211.46 | 217.36 | 2.79% | success |
Trade Execution Analysis
The trade blotter reveals our “Trade the Open” philosophy. Positions are entered and exited with minimal market impact. The Fate column confirms that the 3.0% stop-loss effectively “cuts tails,” preventing outliers from damaging the portfolio.
Account Ledger
| date | Portfolio Value | daily_pnl | Return % |
|---|---|---|---|
| 2022-01-03 | $100,855.81 | 855.807 | 0.86% |
| 2022-01-18 | $95,258.74 | -1274.93 | -1.32% |
| 2022-02-02 | $92,969.02 | -990.546 | -1.05% |
| 2022-02-17 | $91,418.07 | -317.174 | -0.35% |
| 2022-03-07 | $92,800.11 | -192.8 | -0.21% |
| 2022-03-22 | $97,125.99 | -227.875 | -0.23% |
| 2022-04-06 | $100,058.29 | 1493.49 | 1.52% |
| 2022-04-22 | $96,467.96 | 275.815 | 0.29% |
| 2022-05-09 | $89,095.24 | -1220.5 | -1.35% |
| 2022-05-24 | $92,134.78 | 2233.59 | 2.48% |
| 2022-06-09 | $88,335.30 | -2033.22 | -2.25% |
| 2022-06-27 | $88,759.57 | -1132.88 | -1.26% |
| 2022-07-13 | $87,158.15 | 1307.01 | 1.52% |
| 2022-07-28 | $90,813.16 | 347.802 | 0.38% |
| 2022-08-12 | $94,361.40 | 888.235 | 0.95% |
| 2022-08-29 | $91,590.62 | -801.931 | -0.87% |
| 2022-09-14 | $89,241.55 | -1261.02 | -1.39% |
| 2022-09-28 | $86,058.16 | -953.127 | -1.10% |
| 2022-10-13 | $86,831.64 | -1708.15 | -1.93% |
| 2022-10-28 | $94,383.32 | 790.943 | 0.85% |
| 2022-11-14 | $92,153.67 | -516.661 | -0.56% |
| 2022-11-30 | $94,665.99 | -1393.54 | -1.45% |
| 2022-12-15 | $91,339.48 | 411.727 | 0.45% |
| 2023-01-03 | $91,031.86 | -174.939 | -0.19% |
| 2023-01-19 | $91,471.90 | 919.956 | 1.02% |
| 2023-02-03 | $90,984.03 | -366.537 | -0.40% |
| 2023-02-21 | $90,295.84 | 345.252 | 0.38% |
| 2023-03-08 | $88,514.85 | -1675.19 | -1.86% |
| 2023-03-23 | $87,307.02 | 1585.73 | 1.85% |
| 2023-04-10 | $90,065.42 | 389.224 | 0.43% |
| 2023-04-25 | $90,022.27 | -200.049 | -0.22% |
| 2023-05-10 | $90,150.76 | 49.3027 | 0.05% |
| 2023-05-25 | $90,042.36 | 976.168 | 1.10% |
| 2023-06-12 | $92,703.71 | 170.211 | 0.18% |
| 2023-06-27 | $93,907.45 | -13.2235 | -0.01% |
| 2023-07-13 | $96,114.70 | 28.9509 | 0.03% |
| 2023-07-28 | $95,384.21 | -842.928 | -0.88% |
| 2023-08-14 | $93,383.09 | -420.617 | -0.45% |
| 2023-08-29 | $94,734.24 | 87.7644 | 0.09% |
| 2023-09-14 | $92,643.59 | -805.71 | -0.86% |
| 2023-09-29 | $89,183.97 | -745.106 | -0.83% |
| 2023-10-16 | $91,619.67 | 134.988 | 0.15% |
| 2023-10-31 | $89,383.95 | 1479.15 | 1.68% |
| 2023-11-15 | $93,108.76 | 423.86 | 0.46% |
| 2023-12-01 | $94,121.92 | 204.036 | 0.22% |
| 2023-12-18 | $96,079.84 | 315.27 | 0.33% |
| 2024-01-04 | $95,981.12 | 605.82 | 0.64% |
| 2024-01-22 | $99,974.45 | 657.89 | 0.66% |
| 2024-02-06 | $103,794.36 | 622.575 | 0.60% |
| 2024-02-22 | $106,636.05 | -8.49807 | -0.01% |
| 2024-03-07 | $109,821.48 | -1323.34 | -1.19% |
| 2024-03-22 | $113,148.21 | 72.1309 | 0.06% |
| 2024-04-09 | $112,598.75 | 1120.47 | 1.01% |
| 2024-04-24 | $111,433.54 | 1052.39 | 0.95% |
| 2024-05-09 | $115,524.09 | 130.765 | 0.11% |
| 2024-05-24 | $115,435.87 | -1368.56 | -1.17% |
| 2024-06-11 | $116,692.60 | -46.1346 | -0.04% |
| 2024-06-27 | $116,755.44 | 153.307 | 0.13% |
| 2024-07-15 | $119,036.91 | -421.641 | -0.35% |
| 2024-07-30 | $116,687.52 | -45.7501 | -0.04% |
| 2024-08-14 | $120,204.14 | 165.73 | 0.14% |
| 2024-08-29 | $123,993.64 | 310.392 | 0.25% |
| 2024-09-16 | $124,737.52 | -785.827 | -0.63% |
| 2024-10-01 | $126,535.32 | 519.743 | 0.41% |
| 2024-10-16 | $129,773.63 | -536.149 | -0.41% |
| 2024-10-31 | $126,482.24 | -854.481 | -0.67% |
| 2024-11-15 | $131,622.23 | -552.782 | -0.42% |
| 2024-12-02 | $136,256.92 | -316.134 | -0.23% |
| 2024-12-17 | $129,360.71 | -3251.08 | -2.45% |
| 2025-01-03 | $131,502.92 | 93.314 | 0.07% |
| 2025-01-22 | $139,525.19 | 438.693 | 0.32% |
| 2025-02-06 | $139,368.76 | -1018.02 | -0.73% |
| 2025-02-24 | $133,027.12 | -1222.02 | -0.91% |
| 2025-03-11 | $123,361.38 | -858.613 | -0.69% |
| 2025-03-26 | $126,277.50 | -716.933 | -0.56% |
| 2025-04-10 | $128,342.77 | 3650.65 | 2.93% |
| 2025-04-28 | $129,301.74 | -446.128 | -0.34% |
| 2025-05-13 | $130,911.73 | -357.624 | -0.27% |
| 2025-05-29 | $135,011.92 | 751.426 | 0.56% |
| 2025-06-13 | $135,302.72 | 226.211 | 0.17% |
| 2025-07-01 | $138,386.53 | 713.41 | 0.52% |
| 2025-07-17 | $138,943.29 | 217.737 | 0.16% |
| 2025-08-01 | $139,768.42 | 1611.87 | 1.17% |
| 2025-08-15 | $138,068.71 | 265.069 | 0.19% |
| 2025-09-02 | $139,691.90 | 601.306 | 0.43% |
| 2025-09-17 | $144,032.54 | 1391.28 | 0.98% |
| 2025-10-02 | $143,245.79 | -401.594 | -0.28% |
| 2025-10-17 | $142,326.44 | 9.77851 | 0.01% |
| 2025-11-03 | $143,693.82 | 290.635 | 0.20% |
| 2025-11-18 | $145,690.35 | 2340.24 | 1.63% |
| 2025-12-04 | $150,629.60 | 1479.59 | 0.99% |
| 2025-12-19 | $153,621.40 | -89.1354 | -0.06% |
| 2026-01-07 | $157,887.42 | 327.917 | 0.21% |
| 2026-01-23 | $163,109.53 | 879.96 | 0.54% |
| 2026-02-09 | $172,807.90 | 476.749 | 0.28% |
| 2026-02-25 | $173,825.23 | -1450.16 | -0.83% |
| 2026-03-12 | $164,557.17 | -186.457 | -0.11% |
| 2026-03-27 | $160,348.43 | -1831.99 | -1.13% |
| 2026-04-14 | $173,120.16 | -1172.93 | -0.67% |
| 2026-04-29 | $178,127.39 | 2115.28 | 1.20% |
Capital Growth Analysis
The daily ledger samples show the steady appreciation of the $100,000 initial capital. The low volatility in daily PnL reflects the benefit of the sector-neutral framework, which focuses on relative stock performance rather than market direction.
Strategic Monitoring & Risk Governance
1. Performance Alignment Monitoring
Going forward, how will we know that the strategy’s performance is in line with backtest expectations?
To ensure real-world performance matches our 0.92 Sharpe Ratio expectation, we will implement a dual-track monitoring system:
- IC Stability Tracking: We will calculate the daily Spearman Information Coefficient (IC). The backtest showed a mean IC of ~0.0086. If the rolling 21-day average IC remains positive and within one standard error of this mean, we consider the factor model to be capturing the intended market phenomena.
- Rolling Hit-Rate Bounds: Our strategy expects a ~53.8% daily hit rate. We will monitor the realized hit rate over a rolling 60-day window. If performance stays within a 95% confidence interval of the backtest hit rate, the strategy is deemed “in-line.”
2. Quantifying Strategy Failure
How will we quantify when the strategy stops working?
A strategy is considered “broken” or “failed” if it breaches any of the following quantitative thresholds:
- Maximum Drawdown Breach: If the strategy hits a drawdown of 24.5% (1.5x our historical maximum of -16.36%), all trading will be halted. This level represents a statistical outlier that suggests the risk-control parameters are no longer sufficient.
- Factor Signal Decay: If the composite Factor IC remains negative for more than two consecutive 6-month walk-forward folds, we conclude that the underlying momentum premiums have decayed and the model will be retired.
Methodology
Entry Logic
The strategy employs a Sector-Neutral framework to focus on idiosyncratic alpha.
- Universe: S&P 500 constituents.
- Optimization: 3-year rolling training window.
- Selection: Daily rebalancing into top decile names.
Risk Management
Strict risk controls ensure long-term strategy survival.
- Exit: Daily rotation to fresh signals.
- Stop-Loss: 3.0% hard intra-day exit.
- Audit: 100% fate tracking for all trades.